February 9th, 2026
From Traffic to Pipeline: Measuring SEO's ARR Impact for SaaS in 2026
 WD
WDWarren Day
Your CEO looks up from the board deck and asks, "What's our actual ROI on SEO?" If your answer starts with "traffic is up..." or "we're ranking for..." you've already lost.
In 2026, SaaS leaders demand financial clarity, not vanity metrics. I've sat in too many budget reviews where marketing teams show beautiful charts of organic sessions climbing month over month, only to watch the CFO's eyes glaze over. The question that follows is always the same: "How much ARR did SEO actually generate?" And the silence that follows tells you everything.
Here's the thing: most B2B SaaS companies are measuring SEO wrong. You've invested in the best AI SEO tools, hired content writers, maybe even brought on an agency. Leads are flowing into HubSpot tagged as organic. But when finance asks you to prove that SEO contributed to the $2.3M in new ARR this quarter, you're stuck pointing at correlation instead of causation.
The problem isn't your effort.
It's that last-click attribution (the default model in most CRMs) systematically undercounts every channel that isn't the final touch before conversion. For SEO, which often introduces prospects months before they're ready to buy, this is fatal. Switch from last-click to multi-touch models and SEO's attributed contribution can jump from 3% to 40%.
The solution isn't another tool. It's a hybrid measurement framework that combines multi-touch attribution modeling, product-led growth signals, and statistical incrementality testing to build an undeniable financial case for your organic program.
By the end of this guide, you'll know exactly how to calculate an "SEO ARR Impact Score" that survives board scrutiny. Complete with the data pipeline, attribution logic, and dashboard templates you need to prove it.
Why Last-Click Attribution Fails SaaS (And What 'Influenced ARR' Really Means)
Here's what actually happens when someone buys your software: A product manager reads your blog post on API rate limiting in February. She bookmarks your comparison guide in March. Downloads your ROI calculator in April. Watches a demo recording in May. Then clicks a Google ad for "[your brand] pricing" and converts in June.
Last-click attribution gives 100% of the credit to that final paid search click. SEO gets zero.
This isn't a minor accounting quirk. It systematically erases the channel that started the relationship. The average B2B SaaS deal involves multiple touchpoints over 84 days, and enterprise cycles stretch past 120 days. SEO almost always shows up first, that initial content hit that sparks awareness before anyone fills out a form or talks to sales.
The financial impact? Massive. When one B2B company switched from last-click to multi-touch attribution, SEO's measured contribution jumped from 3% to 30-40% of pipeline. Same traffic. Same conversions. Completely different story about what was actually driving revenue.
You need to think in terms of influenced ARR, not just closed ARR.
Closed ARR is the annual contract value where SEO was the final touch before purchase. The last-click number your current dashboard probably shows. Influenced ARR is the portion of annual recurring revenue where SEO appeared anywhere in the buyer's journey as a contributing touchpoint.
If a customer signs a $50K annual contract and organic search appeared in three of their seven interactions before close, that's $50K of SEO-influenced ARR. You're not claiming SEO closed the deal solo. You're quantifying its role in a multi-channel journey.
The mindset shift is simple but radical: stop asking "What did SEO close?" and start asking "What revenue would not exist without SEO's involvement?"
That question requires a different measurement system entirely. One that tracks the full journey, weights contributions intelligently, and connects organic sessions to actual contract value. Last-click can't answer it. Your current GA4 dashboard can't answer it. You need a hybrid attribution framework built specifically for long, complex B2B buying cycles.
The 2026 Attribution Framework: A 4-Layer Measurement Pyramid
Think of SEO measurement like building a skyscraper. You need a foundation, structural supports, functional floors, and a penthouse where the money lives. Most teams are trying to measure ARR impact while standing in the basement with a flashlight.
Here's the architecture that actually works:
Layer 1: Sessions & Intent (Google Search Console)
This is your raw material. Clicks, impressions, average position, and the exact queries people typed before landing on your site.
Search Console shows you demand before it becomes traffic. What your market is actively searching for. This is where ai seo optimization begins: understanding which problems your prospects are trying to solve at 2 AM when they're Googling "alternative to [your competitor]."
Retention window: 16 months. Export religiously or lose it forever.
Layer 2: Engagement & Behavior (GA4)
What happens after the click? GA4 tracks engaged sessions, scroll depth, time on page, and custom events like demo requests, pricing calculator interactions, resource downloads. This layer separates tire-kickers from serious buyers. A visitor who reads three comparison articles, downloads a template, and returns twice is signaling intent even if they don't convert today.
Layer 3: Pipeline & Progression (CRM)
Your HubSpot or Salesforce instance is the bridge to revenue. Every lead, MQL, SQL, and opportunity stage gets logged here, along with the touchpoints that influenced progression. This is where you map organic sessions to actual humans with email addresses, company names, and deal values.
Without clean CRM integration, you're guessing.
Layer 4: ARR & Finance
Closed-won deals. Contract values. Expansion revenue. Churn. This is the penthouse where marketing activity translates into cash that pays salaries and funds growth.
The magic happens when you connect all four layers with a single metric: your SEO ARR Impact Score.
The formula: Σ (Influenced Pipeline Value × Stage Probability × Attribution Weight)
Translation: For every deal in your pipeline, calculate the dollar value, multiply by the likelihood it closes (based on historical stage conversion rates), then apply an attribution weight based on how many touchpoints SEO contributed. Sum across all influenced opportunities, and you have a defensible number to put in front of your CFO.
We'll build this calculation step-by-step in section 8. But first, you need to make sure your data pipeline can actually feed it.
Step 1: Map Your Unique SaaS Conversion Funnel
Before you can measure SEO's ARR impact, you need to know exactly what you're measuring.
Most SaaS companies skip this step and wonder why their attribution models produce garbage. Look, your funnel isn't generic. A sales-led enterprise motion looks nothing like a product-led freemium play, and trying to force-fit one model onto the other is why your CRO dashboard shows organic "contributing" to everything and nothing at the same time.
Sales-Led Funnel (Traditional B2B):
Visitor → Lead (form fill) → MQL (marketing qualified) → SQL (sales accepted) → Opportunity → Closed-Won
Product-Led Growth (PLG) Funnel:
Visitor → Sign-up (trial/freemium) → Activation (hit value milestone) → Paid Conversion → Expansion
Most companies run a hybrid. You might have a freemium tier and an enterprise sales team. Map both paths separately, because the conversion math and attribution windows are completely different.
Here's what the data says you should expect at each stage:
| Funnel Stage | SMB/Mid-Market | Enterprise | SEO Channel (where available) |
|---|---|---|---|
| Visitor → Lead | 1.4% | 0.7% | 2.1% (overall SEO) |
| Lead → MQL | 41% | 39% | — |
| MQL → SQL | 39% | 31% | 51% (SEO leads convert better) |
| SQL → Opportunity | 42% | 36% | — |
| Opportunity → Close | 39% | 31% | — |
| PLG: Freemium → Paid | — | — | 2.6% (organic traffic) |
Notice something? SEO-sourced leads convert to SQL at 51%, significantly higher than the average MQL-to-SQL rate. This is exactly the kind of insight that gets buried under last-click attribution.
Your task right now: Open a spreadsheet. List every stage in your funnel. Pull your actual conversion rates from HubSpot or Salesforce for the last 90 days.
Compare them to these benchmarks. If you're wildly off (say, 0.3% visitor-to-lead when you should be at 1.4%), you have a conversion problem, not an attribution problem. Fix the funnel before you build the dashboard.
Addressing Product-Led Growth (PLG) Funnels
PLG changes everything about how you track conversions.
If your product has a freemium tier or self-serve trial, forget the traditional lead-based model. You're not chasing MQLs. You're tracking what people actually do inside your product.
The key difference: In PLG, the product itself is the qualification mechanism. Someone who signs up, creates their first project, and invites a teammate? They're serious. That's your signal, not a form fill or a sales call.
Define your PLG conversion milestones:
Start with sign-ups at the top of your funnel. Then identify your activation event, that "aha moment" where users extract real value. For project management tools, it's often "created first project." For analytics platforms, "connected data source."
Activation rates typically range from 25–40%, with best-in-class hitting value delivery in 1–7 days.
Next, track your free-to-paid conversion. 2.6% of freemium users convert to paid when they arrive via organic search. For opt-in trials, expect 8.5% of organic visitors to start a trial, with 18.2% of those converting to paid.
Measuring SEO's role in PLG:
Here's where most teams screw up. They can't connect that blog post from three months ago to the paid conversion happening today.
Capture the user's original acquisition source (UTM parameters or GA4 session data) at sign-up and write it to your product database alongside their user ID. When they convert to paid three months later, you can trace that ARR back to the exact blog post that brought them in. Without this instrumentation, you're blind to which organic content actually drives revenue versus vanity sign-ups that never activate.
Step 2: Instrument Your Stack - The Essential Data Pipeline
You can't measure what you don't capture.
Most SaaS companies have the data. It's just trapped in silos that don't talk to each other. GA4 knows someone read a blog post. Your CRM knows they became a customer. Product analytics knows they activated. But if those three systems can't connect the dots through a shared identifier, you're flying blind on attribution.
Here's the architecture that actually works:
The Data Flow
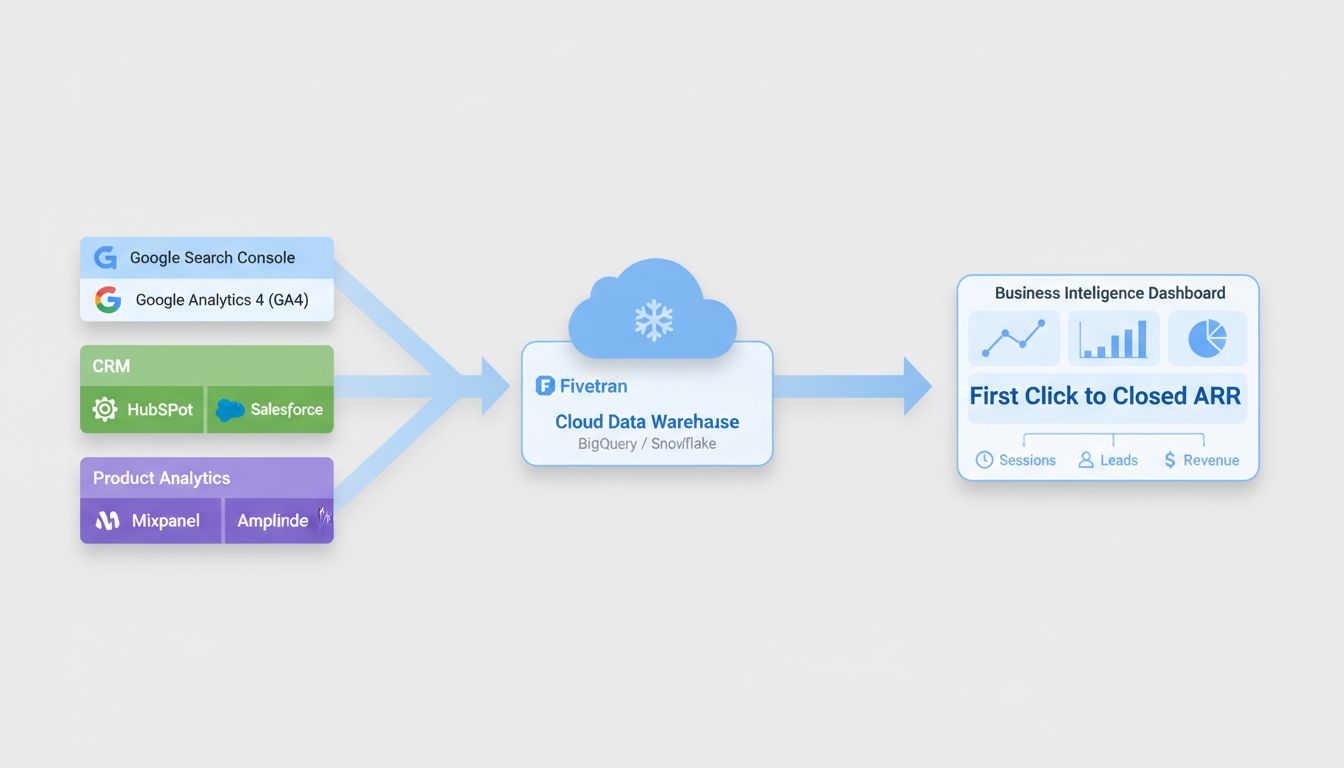
Google Search Console and GA4 feed raw session and event data into a data warehouse (BigQuery or Snowflake) via an ETL tool like Fivetran. Your CRM (HubSpot or Salesforce) and product analytics (Mixpanel, Amplitude) also pipe into the same warehouse. Once everything lands in one place, you can run SQL joins across session data, lead records, and product events to build a complete picture from first click to closed ARR.
The non-negotiable piece: GA4's BigQuery export. This gives you raw, unsampled event data that you can't get from the GA4 interface. Without it, you're stuck with GA4's native attribution models (last-click or data-driven only) and can't build custom multi-touch logic.
The Golden Record Problem
Cookie-based tracking is dead or dying. Third-party cookies are gone in most browsers, and even first-party cookies break across devices and sessions.
Your defense: deterministic matching through a unified user identifier. When someone fills out a form, signs up for a trial, or logs into your product, capture their email or user ID and write it back to GA4 as a User-ID. Do the same in your CRM and product database. Now you have a durable thread connecting anonymous sessions to known leads to paying customers, regardless of cookies.
This is table stakes for PLG companies. If you can't connect a user's pre-signup browsing (organic blog reads) to their post-signup product behavior (feature adoption, upgrade), you'll systematically undercount SEO's influence on expansion ARR.
CRM Sync Hygiene
If you're running HubSpot and Salesforce together, you're probably leaking attribution data at the integration layer. Proper object mapping prevents roughly 80% of sync failures.
Run a quarterly audit. Confirm that contact sources, deal stages, and custom fields (especially UTM parameters and landing pages) are syncing bidirectionally without data loss.
The pipeline isn't glamorous, but it's the foundation. Get this right once, and every downstream attribution model becomes possible.
Step 3: Implement a Hybrid Attribution Model (The U-Shaped Bridge)
Last-click attribution says the final touchpoint gets all the credit. Multi-touch says every touchpoint gets equal credit. Both are wrong for B2B SaaS.
Your buyer's journey isn't linear. A prospect reads your blog post on "API rate limiting best practices" in January, downloads a comparison guide in March, attends a webinar in April, and finally converts via a branded Google search in May. Last-click gives 100% credit to that branded search. Equal-weight multi-touch gives your webinar the same credit as a random newsletter open.
Neither reflects reality.
U-shaped attribution solves this. It assigns 40% credit to the first touch (awareness), 40% to the last touch (decision), and splits the remaining 20% across all middle interactions. For B2B SaaS, this mirrors how buying actually works: someone discovers you exist, evaluates alternatives over weeks or months, then converts. Position-based models like U-shaped are widely adopted in B2B because they credit both discovery and conversion without inflating the middle.
Here's how to build it.
Assign weights by touchpoint position. First, tag every session in your unified data table with a touchpoint sequence number. If a user has five sessions before converting, session one is touchpoint 1, session five is touchpoint 5. Then apply the U-shaped logic:
-- Simplified U-shaped attribution weighting
WITH touchpoints AS (
SELECT
  user_id,
  session_id,
  channel,
  ROW_NUMBER() OVER(PARTITION BY user_id ORDER BY session_timestamp) AS touch_position,
  COUNT(*) OVER(PARTITION BY user_id) AS total_touches
FROM unified_sessions
WHERE converted = TRUE
),
weighted_touches AS (
SELECT
  user_id,
  channel,
  CASE
    WHEN touch_position = 1 THEN 0.40  -- First touch
    WHEN touch_position = total_touches THEN 0.40  -- Last touch
    ELSE 0.20 / NULLIF(total_touches - 2, 0)  -- Middle touches
  END AS attribution_weight
FROM touchpoints
)
SELECT
channel,
SUM(attribution_weight) AS total_attributed_conversions
FROM weighted_touches
GROUP BY channel;
Handle organic search nuances. Non-branded SEO queries ("project management software for agencies") are almost always first-touch awareness. Branded searches ("YourProduct login") typically cluster at last-touch. Category terms ("CRM integrations") often appear mid-funnel. Tag your organic sessions by query intent in Google Search Console, then route them to the correct attribution bucket.
Validate with data-driven attribution. GA4's data-driven model uses machine learning to assign credit based on actual conversion paths. Export GA4's DDA results monthly and compare them to your U-shaped output. If GA4 consistently assigns more credit to mid-funnel content, adjust your middle-touch weight from 20% to 25% and rebalance. Your U-shaped model should be a living system, not a static formula.
This hybrid approach gives you something defensible in board meetings that actually reflects how ai seo optimization and content drive pipeline over time. U-shaped as your baseline, refined by data-driven signals. Not perfect, but dramatically better than pretending every click matters equally or that only the last one counts.
Integrating AI SEO Tools into Your Measurement Stack
Here's the mistake most teams make: they treat the best ai seo tools as optimization platforms—something you log into to fix meta descriptions or track rankings. But if you want to prove ARR impact, you need to treat these tools as data sources that feed your attribution model.
The question isn't "which tool ranks our keywords?" It's "which data points from these tools correlate with pipeline velocity and deal size?"
Beyond Ranking Reports: Tools as Attribution Inputs
When you run Ahrefs or Clearscope, you're generating structured data that can predict conversion behavior. A piece of content that goes from position 12 to position 4 doesn't just get more traffic—it typically sees a 15-20% lift in visitor-to-lead conversion because higher-ranking content signals stronger topical authority to buyers.
That ranking velocity becomes a leading indicator in your ARR model.
If you can show that pages moving up 5+ positions correlate with a 0.3-point increase in MQL-to-SQL conversion rate, you've just turned ai seo optimization tools into a forecasting layer. Not a reporting dashboard. A forecasting layer.
Here's how different tools plug into your measurement stack:
| AI SEO Tool | Primary Use Case | Data Point for ARR Model |
|---|---|---|
| Ahrefs / Semrush | Rank tracking, backlink analysis | Ranking velocity → correlate with conversion rate uplift |
| Clearscope / Surfer SEO | Content optimization | Content score → correlate with lower time-to-MQL |
| Profound | AI citation monitoring | Citation velocity → signal of topical authority growth |
| MarketMuse | Topic strategy & gaps | Topic authority score → maps to 'consideration stage' influence |
Pull these metrics into your data warehouse alongside GA4 and CRM data. When you join Clearscope's content scores to HubSpot's deal velocity, you can run a regression to see if optimized content shortens sales cycles by 8-12 days. It usually does.
Can Free AI SEO Tools Support This Measurement?
Let's be direct: free ai seo tools like ChatGPT for keyword ideation or Google Search Console's basic reports are useful for content creation, but they don't generate the systematic, trackable data outputs your ARR model needs.
GSC gives you clicks and impressions—valuable, but not structured for attribution joins. ChatGPT can draft an outline, but it won't tell you which topics correlate with higher deal values. You can't export systematic tracking data that joins cleanly to your CRM without building a ton of custom infrastructure.
Free tools work fine for early-stage companies. Once you're defending a six-figure SEO budget, you need paid platforms that export API data into your warehouse and support cohort-level analysis. The cost difference stops mattering when you can actually prove what's driving revenue.
Step 4: Calculate Your SEO ARR Impact Score
Now we get to the number that actually matters—the one your CFO will put in a spreadsheet and your CEO will repeat in the next board meeting.
The SEO ARR Impact Score is the dollar value of annual recurring revenue you can credibly attribute to organic search. Not influenced by. Not "touched by." Attributed to, using the hybrid model you built in Step 3.
Here's the formula:
1. Sum all influenced pipeline value (every opportunity where SEO was a touchpoint in the journey).
2. Apply your stage probability (your historical SQL-to-Close rate—39% for SMB/Mid-Market, 31% for Enterprise).
3. Apply your attribution weight from your hybrid model (40% if SEO was the first touch in a U-shaped model, 20% if it was mid-funnel).
4. Sum the credited value across all influenced opportunities.
5. Divide by average customer lifespan (or use first-year contract value if you're being conservative).
Let's walk through a real example using SMB benchmarks.
Assume you drove 10,000 organic sessions last quarter. Here's how that converts through the funnel:
| Stage | Conversion Rate | Count | Source |
|---|---|---|---|
| Organic Sessions | — | 10,000 | Your GA4 |
| Leads | 2.1% | 210 | SEO visitor-to-lead |
| MQLs | 41% | 86 | SMB lead-to-MQL |
| SQLs | 51% | 44 | SEO MQL-to-SQL (higher than average) |
| Opportunities | 42% | 18 | SMB SQL-to-Opp |
| Closed-Won | 39% | 7 | SMB Opp-to-Close |
At an average deal size of $26,265, those 7 deals represent $183,855 in new ARR.
But here's where most people mess up. Not all of those deals should get 100% credit to SEO. If you're using U-shaped attribution and SEO was the first touch for 60% of those deals, you assign 40% credit: $183,855 × 0.60 × 0.40 = $44,126 in first-touch attributed ARR.
Add mid-funnel and last-touch credits from the remaining opportunities, and you land at your total SEO ARR Impact Score.
For PLG companies, the math is simpler. If you drove 5,000 freemium signups from organic and 2.6% convert to paid, that's 130 paying customers. Multiply by your average first-year ACV, apply attribution weight, done.
The key is consistency. Use the same model, same benchmarks, same attribution weights every quarter so your trend line is comparable. You can't change your methodology halfway through the year and expect anyone to trust your numbers.
Step 5: Build Your Board-Ready Dashboard
Your CFO doesn't want to see a 47-slide deck about keyword rankings. They want one screen that answers: "Is SEO making us money?"
Here's the dashboard layout that survives board scrutiny:
Top-left quadrant: The money metric. Display your SEO ARR Impact Score as a single number with month-over-month trend. Right below it, show SEO-influenced pipeline dollars versus total pipeline. If SEO is contributing $2.3M to a $12M pipeline, that's 19%. That percentage trend is what leadership will remember.
Top-right: The efficiency proof. Plot your organic channel funnel next to paid and direct. When your board sees that SEO-sourced MQLs convert to SQL at 51% versus 39% for other channels, the "why are we spending on SEO?" question disappears.
Bottom-left: Content ROI table. Forget pageviews. List your top 10 URLs ranked by influenced pipeline dollars. The comparison page that drove $340K in attributed ARR deserves more love than the blog post with 50K sessions and zero conversions. This table tells you exactly what to write more of.
Bottom-right: The timeline view. Plot keyword ranking improvements on one axis and pipeline creation events on the other, with a 60-90 day lag overlay. When leadership sees rankings climb in Q2 and pipeline spike in Q3, causation becomes obvious.
Pull GA4 session data and your BigQuery attribution model into Looker Studio. Connect your CRM (Salesforce or HubSpot) via native connector or a middleware like Zapier. For product analytics, export Mixpanel cohorts to your data warehouse and join on user_id. The technical setup sounds worse than it is.
The monthly narrative matters more than the dashboard itself.
"SEO-influenced pipeline grew 18% month-over-month while cost per influenced deal dropped from $1,840 to $1,620" lands harder than "organic traffic hit 85K sessions." Trends prove momentum. Vanity metrics prove nothing.
Common Pitfalls & 2026-Proofing Your Model
You've built the framework. Now let's talk about the landmines that blow it up.
Pitfall 1: The Last-Click Default
Most teams implement a hybrid model, then quietly revert to last-click reporting because "it's easier to explain." This isn't just lazy. It's financially destructive. Case studies show SEO contribution rising from 3% to 40% when you switch from last-click to multi-touch. That's not a rounding error. That's the difference between cutting your SEO budget and doubling it.
If your CRM defaults to last-click and nobody questions it, you're systematically defunding the channel that starts most of your deals.
Pitfall 2: Short Attribution Windows
B2B software isn't bought in a weekend. The average sales cycle runs 84 days, and the research journey starts months earlier. A 30-day attribution window measures impulse purchases, not enterprise deals.
Set your look-back to 6–12 months minimum. Yes, it complicates cohort analysis. Do it anyway.
Pitfall 3: Ignoring Cross-Device & Cookie Deprecation
Third-party cookies are dead. If your attribution still depends on them, your model has an expiration date.
The fix: deterministic matching with first-party identifiers. Email, user ID, authenticated sessions. This isn't optional anymore. It's table stakes. Go back to Step 2 and audit your unified ID strategy. If you can't track a prospect from anonymous blog reader to signed contract using first-party data, your attribution will collapse the moment Chrome flips the switch.
Pitfall 4: Correlation vs. Causation
Multi-touch models tell you what happened. They don't prove SEO caused it. For that, you need incrementality testing. Geo-based holdouts where you suppress SEO in one region and measure the lift in another.
It's the gold standard, but it requires scale and statistical rigor (think α=0.05, power=0.8). Most Series A companies can't run it yet. That's fine. Start with U-shaped attribution, refine with GA4's data-driven model, and add incrementality tests when you hit the ARR to justify them.
The Path Forward
This isn't a one-and-done implementation. Your model should evolve: start with position-based attribution, layer in algorithmic weights as your data matures, and validate with experiments when you have the volume. The companies that win in 2026 treat attribution like product development. Iterative, testable, always improving.
Conclusion
You started this article with a CEO asking about SEO's ROI. Now you have the framework to answer with a number, not a story.
The shift from last-click to hybrid attribution isn't cosmetic. It's the difference between showing "SEO contributed to 3% of deals" and "SEO influenced $1.2M in ARR this quarter." One gets your budget cut. The other gets it doubled.
The five steps aren't theoretical. Mapping your funnel, instrumenting your stack, implementing U-shaped attribution, calculating your SEO ARR Impact Score, building a board-ready dashboard—that's the exact sequence I've watched growth teams execute at Series B and C companies to move SEO from a "nice to have" line item to a top-three revenue driver.
Your CFO won't care that you ranked #1 for a keyword. They will care that organic-sourced deals close 18% faster and have 22% higher LTV than paid leads. That's the language of budget defense.
Start with the U-shaped model. Get your data pipeline clean. Build the dashboard. Then refine with experiments as your volume scales.
For teams looking to operationalize this framework and automate content insights that feed directly into your attribution model, explore SpectreSEO's performance dashboard. The measurement system you build this quarter determines the budget you defend next year.