March 20th, 2026
Beyond Likes: Using Free Social Media Tools to Track AI SEO KPIs in 2026
 WD
WDWarren Day
You're tired of reporting on likes and shares. The boss wants ROI. Meanwhile, AI Overviews dominate search results, and you suspect your content is being overlooked. You've searched for free social media management tools, hoping they might solve both problems.
Here's the uncomfortable truth: Your social metrics look great, but they're not paying the bills.
You're posting consistently with Buffer, designing eye-catching graphics in Canva, and tracking engagement rates that trend upward. Yet when you're asked to prove how social media drives revenue, you're stuck showing follower counts and reach numbers that don't translate to pipeline. It's the same story everywhere.
At the same time, search behavior has fundamentally changed. AI Overviews now appear in a significant portion of queries, and when they do, traditional organic clicks can drop by half or more. Your carefully crafted content might be generating zero visibility because AI systems aren't citing you as a source.
Most advice tells you to buy expensive enterprise SEO platforms or hire a dedicated team. But you're running a 15-person SaaS startup. That's not happening.
Here's what actually works: In 2026, the data from your free social media management tools can be integrated with free analytics platforms to track the AI SEO KPIs that actually matter. Brand visibility in AI answers, citation rates, and high-converting AI referral traffic. No enterprise software required.
This article will show you exactly which AI SEO metrics move the needle, how to extract them from tools you already use, and how to build a dashboard in Looker Studio that finally connects your social activity to business outcomes.
Why Likes No Longer Pay the Bills: The 2026 Measurement Gap
You already know the routine. Every Monday morning, you pull up your social media dashboard, screenshot the engagement numbers, and drop them into a slide deck. Likes are up 12%. Shares climbed 8%. Your boss nods, then asks the question that makes your stomach drop: "How many leads did this generate?"
You don't have an answer.

For years, likes and follower counts worked as decent proxies for brand health. More engagement meant more visibility, which theoretically meant more customers. That logic held when search engines displayed ten blue links and social platforms actually functioned as discovery engines. In 2026, that assumption is dead.
The problem isn't that vanity metrics lie. It's that they measure the wrong outcome. A post with 500 likes might generate zero qualified leads. Another with 50 likes might drive three enterprise deals. Without connecting social activity to downstream business results, you're reporting on activity, not impact. Your CFO doesn't care about impressions. They care about pipeline.
And right now, you can't prove that your social strategy contributes to it, even when it does.
Here's where the pressure intensifies: AI search has fundamentally altered how potential customers discover your brand. When AI Overviews appear in search results, clicks drop by approximately 34.5%. Those carefully optimized blog posts now compete with AI-generated summaries that answer questions without sending traffic to your site. The content you spent hours perfecting gets cited, if you're lucky, but the visitor never lands on your page.
This shift creates a measurement gap that most free social media management tools weren't designed to address. They'll tell you when to post and how many people saw it. They won't tell you whether your content was cited in an AI Overview, whether that citation drove qualified traffic, or how AI referrals convert compared to traditional search. You're using best social media management tools to optimize for a game that's already changed.
Look, the solution isn't abandoning social media or buying expensive enterprise SEO platforms. It's repurposing the tools you already have to track the metrics that actually correlate with revenue: brand citations in AI answers, AI-assisted conversions, and the quality of traffic those citations generate.
That's what the rest of this guide will show you how to build.
How Social Media Activity Fuels AI Search Visibility
Your social media posts aren't just engagement bait anymore. They're building the brand authority signals that AI systems use to decide whether you're worth citing.
Here's the mechanism: When someone sees your TikTok video or LinkedIn post and then searches for your brand name, that search query becomes a signal. Google and other platforms interpret rising branded search volume as a trust indicator. AI models, in turn, treat brands with strong search demand as more authoritative sources when generating answers.
The funnel looks like this: Social Activity → Increased Brand Searches → Higher Entity Authority → Improved AI Citation Likelihood.
This isn't theoretical. When e-commerce brand Emplicit ran a focused TikTok content strategy, they saw brand search impressions increase by 26% across all digital channels within two months. Those weren't TikTok metrics. They were search engine impressions triggered by people who discovered the brand on social and then went looking for it elsewhere.
That matters because 86% of AI citations come from brand-managed sources. If AI systems are pulling from domains and platforms you control, your social presence becomes part of that citation ecosystem. Every post, comment, and share contributes to a coherent entity profile: the collection of signals that tells AI models who you are, what you do, and whether you're credible.
Entity signals work like this: When your brand name appears consistently across your website, LinkedIn company page, Instagram bio, and customer reviews with matching descriptions and terminology, AI models recognize you as a distinct, trustworthy entity. Inconsistent messaging or sparse social presence weakens that profile.
For startups and small teams, this is unusually good news. You don't need a six-figure content budget to build entity authority. Organic social activity, especially on platforms where your audience already spends time, can generate the brand search lift that feeds into AI visibility. The best social media management tools for small business aren't expensive enterprise suites. They're the free platforms that let you maintain consistent, strategic activity across channels without burning out your team.
The catch: You need to know which social activities actually move the needle on brand search, and you need to measure that connection. Most social analytics dashboards won't show you search lift.
That's the integration work we're about to walk through.
The Free Social Media Management Tools You Already Have (And How to Use Them for SEO)
You probably already have the tools. You just haven't been using them to track the right things.
Most founders and marketing managers think of Buffer, Canva, and Meta Business Suite as scheduling and design tools. Fair enough. But they're also sitting on engagement patterns, content resonance data, and brand mention activity that directly correlates with search visibility. The free tiers capture all of this. You just need to know which reports to export and how to read them.
The shift is treating these tools as data extraction systems, not just publishing platforms.
What Makes a Free Tool Useful for SEO Data
Not every free social media management tool will help you track AI search performance. You need three things: export-ready engagement data, topic-level performance breakdowns, and mention or hashtag tracking.
If a tool only shows you vanity metrics without letting you export or segment by content theme, it's useless for SEO measurement. The best free social media management tools let you pull CSV reports or connect to analytics dashboards so you can cross-reference social activity with search lift. That connection is what matters.
The Core Free Tools and Their SEO Data Strengths
Buffer (Free Plan) is built for scheduling, but its "Top Posts" report is where the SEO value hides. Export your highest-engagement posts monthly and tag them by topic or keyword theme. High-engagement topics on social often predict rising search interest, especially for branded queries. The correlation shows up faster than you'd expect.
Buffer's free tier covers up to three social channels and includes basic analytics. Look for posts that drive unusually high click-throughs or shares. Those signal content angles worth expanding into blog posts or landing pages that AI systems can cite.
Canva (Social Media Scheduler) isn't just a design tool anymore. Its built-in scheduler includes an Analytics tab that tracks impressions, engagement, and clicks per visual asset. For B2B SaaS brands, this matters because visual content performance often correlates with brand recall in AI-generated answers. Humans remember what they see. So do language models trained on multimodal data.
Export Canva's performance data and identify which design styles generate the most saves or shares. High-save content signals "reference value," the kind of utility AI systems prioritize when sourcing citations.
Meta Business Suite (free for Facebook and Instagram) provides Insights that break down reach, engagement, and audience demographics. The "Content" tab shows which posts drove profile visits or website clicks, both proxies for brand search intent.
Download weekly Insights reports and filter for posts that spiked profile visits. A sudden jump in profile traffic after a specific post often precedes a lift in branded search queries, which you can later verify in Google Search Console. The lag is usually 3-7 days.
LinkedIn Company Page Analytics (free) tracks impressions, unique visitors, and follower demographics. The "Visitors" tab shows search keywords people used to find your page. Yes, LinkedIn provides keyword data. Something Google stopped doing years ago for organic search.
Export this monthly. If you see upticks in specific job-title or industry keywords, those are signals your brand is gaining authority in those niches. Authority that AI systems will eventually recognize when sourcing B2B answers.
Your Free Tool Data Cheat Sheet
| Tool | Key Report/Export | SEO Insight |
|---|---|---|
| Buffer | Top Posts (Engagement CSV) | High-engagement topics → candidate keywords for blog content |
| Canva Scheduler | Analytics tab (Impressions, Saves) | High-save visuals → reference-value content AI systems prefer |
| Meta Business Suite | Content Insights (Profile visits, Link clicks) | Profile visit spikes → leading indicator of brand search lift |
| LinkedIn Company Page | Visitors tab (Search keywords) | Inbound search terms → niche authority signals for AI citations |
| Hootsuite Free | Streams (Brand mentions, Hashtag tracking) | Mention volume trends → share-of-voice proxy across social channels |
The data is already there. You just need to export it, tag it by theme, and cross-reference it with your search analytics.
That integration step is what turns these free social media scheduling tools into an AI SEO measurement system. Without it, you're just posting into the void and hoping someone notices.
The AI SEO KPIs You Need to Track in 2026 (And Exactly How to Measure Them)
Forget vanity metrics. The KPIs that matter in 2026 measure whether AI systems are finding, citing, and converting your audience, not just whether people double-tapped your post.
These aren't theoretical. Each one can be tracked using free platforms you already have access to. Here's what to measure and exactly how to do it.
AI Citation Incidence & Share of Voice
This KPI answers a simple question: how often does your content show up when AI systems generate answers?
Bing Webmaster Tools launched an AI Performance dashboard that tracks exactly this. It shows total citations in Microsoft Copilot and Bing AI summaries, grounding queries (the searches that triggered your citation), and page-level citation activity over time.
How to access it: Log into Bing Webmaster Tools, navigate to Reports > AI Performance (beta), and connect your verified domain. The dashboard surfaces which pages are being cited, how frequently, and for which query types.
What to look for: If you're getting citations for branded queries but not category queries, your content isn't establishing topical authority yet. Compare your citation count to the number of grounding queries. If the ratio is low, you're being retrieved but not selected. That signals a content depth or credibility issue.
Share of voice matters more than raw citation counts. If competitors own 80% of AI citations in your category, you're invisible regardless of your follower count. Track this monthly and correlate spikes with social campaigns or content launches.
AI-Assisted Conversions & AI Referral Traffic
Here's what should change how you think about traffic volume: AI referral traffic converts at 4.4× the rate of traditional search traffic, even though it represents only 1–3% of overall volume.
You need to measure this in GA4 using custom event tagging. Here's the step-by-step:
-
Identify AI referral sources. In GA4, go to Reports > Acquisition > Traffic Acquisition. Filter by source/medium and look for referrals from
chatgpt.com,perplexity.ai,copilot.microsoft.com, or similar domains. -
Create a custom event. Navigate to Configure > Events > Create Event. Set conditions to trigger when
sourcecontains "chatgpt" or "perplexity" (or whatever AI platforms you're tracking). Name the eventai_referral_visit. -
Tag conversions. In the same Events panel, mark your conversion events (form submissions, demo requests, sign-ups). GA4 will now attribute conversions to AI referral sources.
-
Build a conversion comparison segment. In Explore > Free Form, create two segments: one for AI referral traffic and one for organic search. Compare conversion rates, average session duration, and pages per session.
The Rankmax B2B case study showed AI LLM traffic growing 5,908% to 721 users over 16 months, generating 45 conversions at a 6.24% conversion rate. Roughly 3× higher than their organic search baseline. Your numbers won't match theirs, but the pattern will: lower volume, dramatically higher intent.
AI vs. Traditional Search Conversion Benchmarks
| Traffic Source | Avg. Conversion Rate | Avg. Engagement Time | Share of Total Traffic |
|---|---|---|---|
| AI Referral | 6.2% | 4:12 | 1–3% |
| Organic Search | 1.4% | 2:38 | 35–50% |
| Social Direct | 0.8% | 1:54 | 5–10% |
Benchmarks synthesized from Swydo and Rankmax case data (2025)
Brand Visibility in AI Answers & SERP Features
This KPI tracks whether your brand appears in AI Overviews, featured snippets, and People Also Ask boxes. The real estate that precedes traditional organic results.
Google Search Console is your primary tool here. The November 2025 update added native query-type segmentation, letting you separate branded from non-branded search performance.
How to use it: Open GSC > Performance > Search Results. Apply a filter for "Query" and use regex to isolate branded terms (e.g., your-brand-name|product-name). Compare impressions and CTR for branded queries over the past 90 days. Then remove the filter and look at total impressions for non-branded category terms.
What matters: If branded search impressions spike 20–30% within two weeks of a social campaign, your social activity is driving search demand. The Emplicit TikTok case showed a 26% increase in brand search impressions within two months of launching a consistent posting strategy. Proof that social feeds search visibility, not just engagement.
Cross-reference this with AI Overview presence by checking whether your top-performing pages (by impressions) are appearing in AI-generated summaries. You can't see AI Overview-specific data in GSC yet, but sudden CTR drops on high-impression pages often signal that an AI Overview is absorbing clicks.
Content Comprehensiveness Score
AI systems favor content that fully answers a query cluster, not just a single keyword. This KPI measures whether your content covers the semantic breadth of a topic.
How to measure it: In GSC, navigate to Performance > Pages. Select your top landing page and click through to see all queries that trigger it. Export the list. If your page ranks for 8–12 related queries (not just one), it's comprehensive. If it ranks for 2–3, it's shallow.
Action step: Use the query list to identify gaps. If your page on "social media scheduling" ranks for "best scheduling tools" but not "how to schedule posts" or "social media calendar templates," you're missing subtopics that AI systems expect.
Map these gaps to your social content calendar. If a topic cluster is underperforming in search, it's a signal to create more social posts around those subtopics. Use your free social media management tools to test angles before committing to long-form content. The best social media management tools for small business give you this testing ground without budget pressure.
You're not guessing anymore. You're measuring the KPIs that determine whether AI systems see you as a credible source or scroll past you to cite someone else.
Step-by-Step: Building Your Free AI SEO Dashboard in Looker Studio
This dashboard becomes your central command. Every KPI you just learned to track, AI citations, conversion quality, topic overlap, lives here in one view. No switching between six browser tabs every Monday morning.
Here's how to build it.
Step 1: Connect Your Data Sources
Start with the native connectors. In Looker Studio, click "Create" → "Data Source" and add Google Search Console first. Select your verified property and authorize access. Repeat for Google Analytics 4.
These two connections give you search impressions, clicks, engagement metrics, and conversions without any manual uploads.
Bing Webmaster Tools is trickier, there's no native Looker Studio connector yet. Export your AI Performance report as a CSV (it tracks citations in Microsoft Copilot and Bing AI summaries) and upload it manually via "File Upload" in Looker Studio. Yes, it's a monthly task. Set a calendar reminder for the first Monday of each month.
For social media data from the best free social media management tools like Buffer or Canva, export your post analytics as CSV files. Buffer lets you download engagement data by date range. Canva's Content Planner exports scheduled post performance. Upload these CSVs to Looker Studio and blend them with your GSC data using date as the join key. This lets you compare social topic performance against search query trends in the same table.
Step 2: Create Key Charts for AI SEO Monitoring
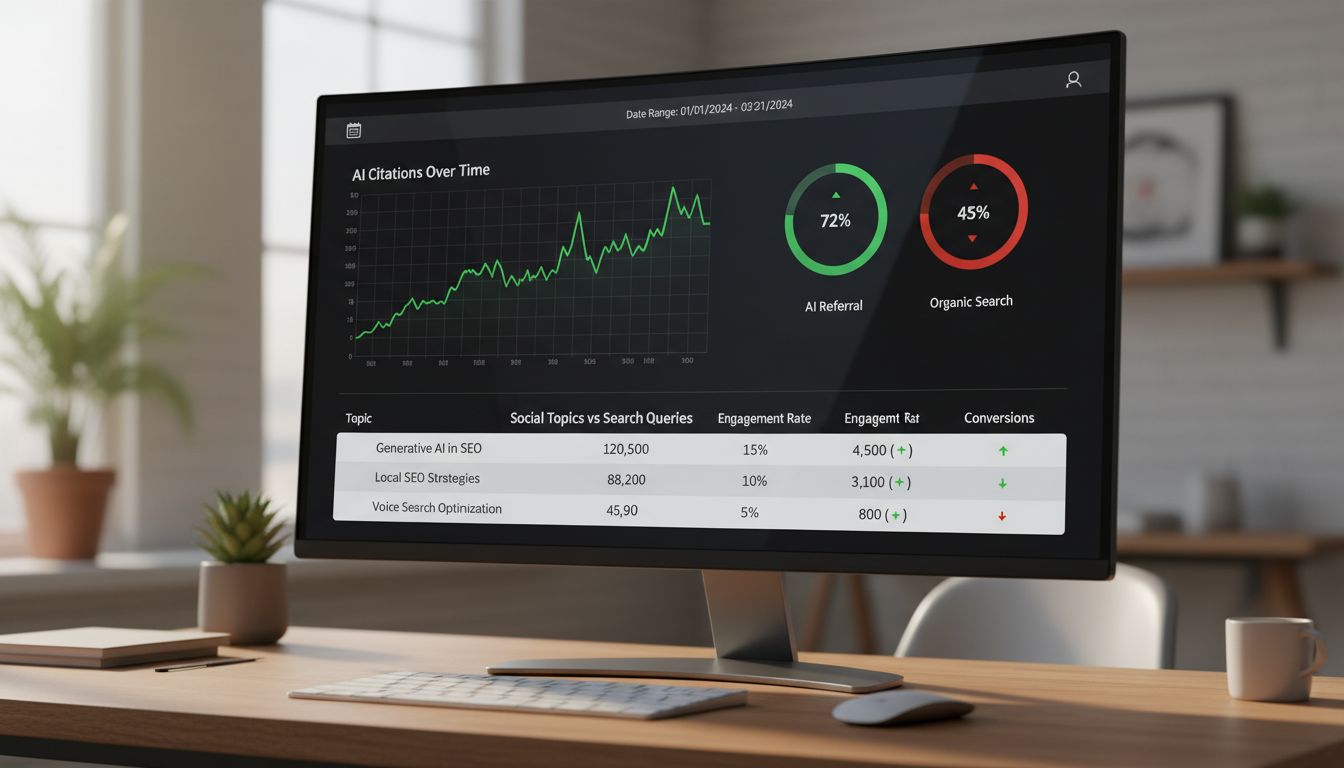
Chart 1: AI Citation Trend Line
Pull your Bing AI Performance data (or use GSC branded query impressions as a proxy). Create a time-series line chart with "Date" on the X-axis and "Total Citations" or "Branded Impressions" on the Y-axis. Add a trendline to spot whether citations are climbing or flat.
If you're not yet in Bing's AI Performance beta, track branded query growth month-over-month. It correlates with AI answer inclusion.
Chart 2: Social Topic vs. Search Query Overlap Table
This is where social media meets search intent. Build a comparison table with two columns: "Top Social Post Topics" (from your Buffer CSV, use post captions or hashtags) and "Top Search Queries" (from GSC). Sort both by impressions or engagement.
The goal is to spot gaps. If your social posts hammer "AI automation tips" but your top search queries are "workflow integration," you've found a content alignment problem. That gap is costing you visibility.
Chart 3: AI Referral Conversion Funnel
In GA4, create a custom segment for sessions with medium = "referral" and source containing "chatgpt," "perplexity," "bing," or "google.com/aio." (You'll need UTM parameters or manual tagging for ChatGPT and Perplexity traffic.) In Looker Studio, build a funnel chart: Sessions → Engaged Sessions → Key Event Completions (conversions).
This shows you exactly how high-intent AI referral traffic behaves compared to organic search. The difference is usually dramatic.
Step 3: Set Up Alerts and Monthly Review Cadence
Looker Studio doesn't have built-in threshold alerts, so schedule a recurring monthly report instead. Click "Share" → "Schedule email delivery" and send it to yourself and your team every first Monday at 9 a.m.
Your review checklist:
- Citation trend: Up, down, or flat? If flat for two months, audit your structured data and outbound citations.
- Conversion rate delta: Compare AI referral conversion rate to organic search. If AI referrals dip below 2×, investigate landing page relevance.
- Topic gap count: How many of your top 10 social topics have zero matching search queries? That's wasted effort.
Step 4: Template Layout & Customization
Your dashboard layout should prioritize speed.
Top left: Citation trend line (biggest visual). Top right: Conversion rate comparison, a scorecard showing AI referral conversion rate vs. organic. Bottom half: The topic overlap table, full width, sorted by impressions descending.
Add a date range control at the top so you can toggle between "Last 30 days" and "Last 90 days" views. Use color coding: green for metrics trending up, red for declining KPIs. Keep it ruthlessly simple, if a chart doesn't answer "Are we being cited?" or "Is it converting?" cut it. Nobody needs decorative widgets.
You now have a dashboard that connects social activity, AI citations, and revenue in one view. No enterprise software required. The best social media management tools for small business already give you most of the data. You're just pulling it into one place where it actually tells you something useful.
Common Mistakes to Avoid (And How to Use Content Rules Like 5-3-2)
Your dashboard is live. Your KPIs are tracking. But six common mistakes can still tank your results before you see a single AI citation.
Mistake 1: Only Tracking Likes and Comments
If your monthly report still leads with follower count and engagement rate, you're measuring activity, not impact. AI systems don't care how many hearts your post earned. They care whether your brand shows up as authoritative when someone asks a question. Track citation incidence and AI referral conversions instead.
Mistake 2: Ignoring Bing Webmaster Tools
Microsoft's AI Performance dashboard is free, tracks Copilot citations, and reports page-level citation activity. Yet most founders skip it because "nobody uses Bing."
Wrong. Microsoft's ecosystem powers ChatGPT's web search, enterprise Copilot, and a growing share of AI-assisted queries. If you're not monitoring it, you're missing a major citation source.
Mistake 3: Not Tagging AI Referral Traffic in GA4
AI referral traffic converts at 4.4× the rate of traditional search traffic, but only if you tag it properly. Skip the UTM parameter setup and you're lumping high-intent AI visitors into "direct" or "referral" buckets. Then you wonder why your conversion attribution looks flat.
Mistake 4: Assuming All Social Content Is Equally Valuable for SEO
A meme might go viral. A product screenshot might drive clicks. But only content that demonstrates topical depth and brand authority feeds AI citation models. Random posts won't build entity signals. Comprehensive topic coverage will.
Mistake 5: Publishing AI-Generated Content Without Human Editing
AI drafts are tempting when you're resource-strapped. But hallucinations and factual errors harm your E-E-A-T signals and poison the well for future citations. Every AI-generated post needs human verification and original insights before it ships.
Mistake 6: Obsessing Over Static Sample Prompts
You can't "optimize for ChatGPT" by reverse-engineering a handful of prompts. AI search is conversational and fluid. Focus on comprehensive, well-structured content that answers related questions, not on gaming a single query pattern.
Integrating Content Rules for SEO Success
You've probably heard of the 5-5-5 rule: five educational posts, five entertaining posts, five promotional posts per cycle. It's rigid, but it does force topical variety.
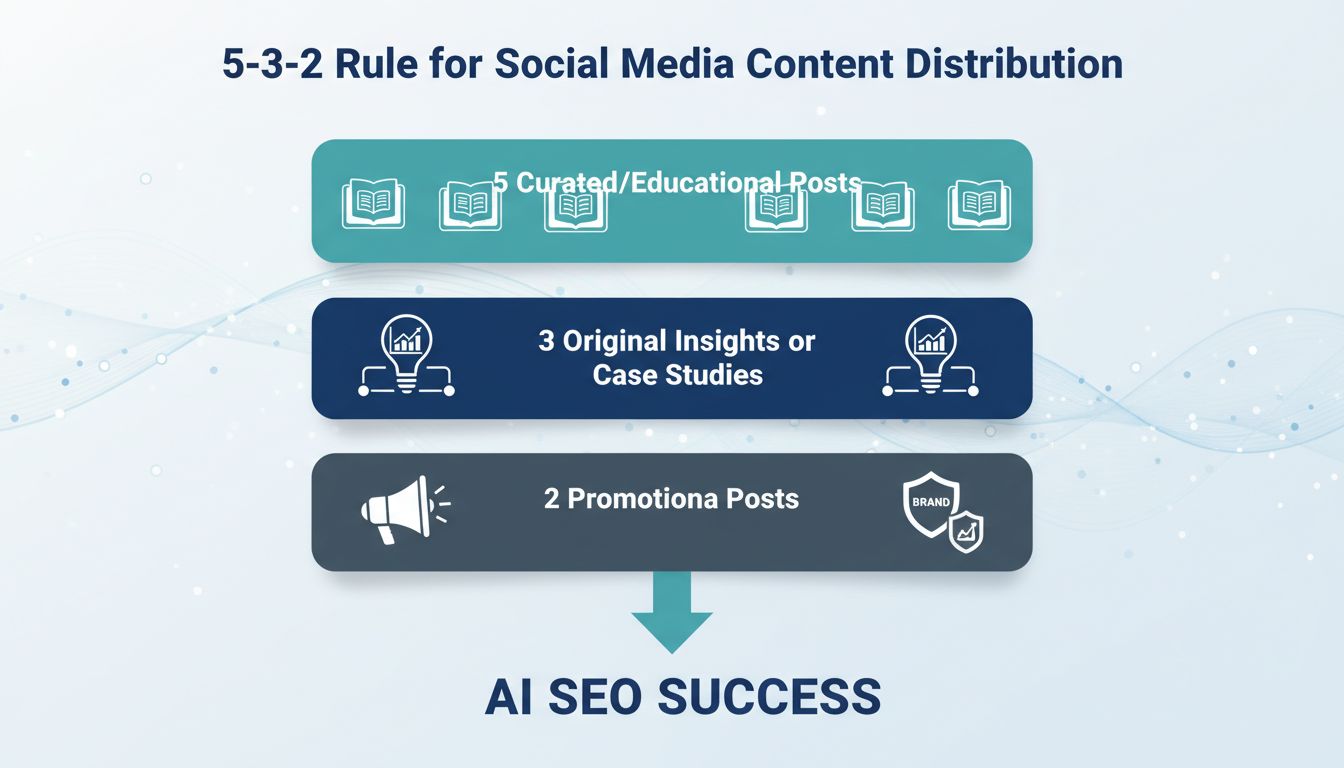
The 5-3-2 rule is better for AI SEO. Five pieces of curated or educational content, three original insights or case studies, two promotional posts. This mix prioritizes depth and authority over volume.
Why does 5-3-2 matter for search? Because those three original pieces, your case studies, your data, your expert takes, are what AI models cite. They're comprehensive. They're attributed to your brand. They map directly to your Content Comprehensiveness Score.
Curated content (the five) builds your topical footprint and signals that you're tracking industry conversations. Promotional posts (the two) drive conversions from the traffic your authority earns. Use 5-3-2 as your publishing cadence, and your social calendar becomes an AI citation engine, especially when you're working with the best free social media management tools or the best social media management tools for small business that actually support this kind of structured planning.
Conclusion: Your 5-Step Action Plan for 2026
You don't need enterprise software to prove your social media work drives real business results. You need a system that connects what you're posting to the AI search visibility that actually converts.
Here's how to build it:
Step 1: Audit Your Social Content
Export your engagement data from Buffer or Hootsuite. Pull your top 20 posts from the last quarter. Cross-reference those topics against your Google Search Console query data. Where do high social engagement and high search impressions overlap? That's your content sweet spot.
Step 2: Set Up GA4 Tagging for AI Referral Traffic
Implement the UTM tagging structure from Section 5. Tag your social posts with utm_source=chatgpt or utm_source=perplexity when you share links. Create the custom event in GA4 to capture AI referral conversions. This takes 20 minutes.
Step 3: Build Your Looker Studio Dashboard
Follow the connector setup in Section 6. Link GSC and GA4. Add the Bing Webmaster Tools AI Performance widget if you've claimed your site. You now have a single view of impressions, citations, and conversions.
Step 4: Schedule a Monthly Review Using the 5-3-2 rule
First Monday of every month: review your dashboard, identify your top-performing content types, and plan next month's calendar using the 5-3-2 publishing cadence.
Step 5: Claim Your Bing AI Performance Data
Submit your site to Bing Webmaster Tools. Enable the AI Performance dashboard. Even if Bing isn't your primary traffic source, it's the only free citation tracker available right now.
This setup is professional-grade, completely free, and within your reach today. Whether you're using buffer social media tools, the best social media management tools for small business, or free social media management tools, this framework works. You're measuring what matters. You're tracking AI visibility. And you're proving your work drives revenue, not just vanity metrics.
This guide reflects the state of free tools and AI search as of Q1 2026. Review the Bing AI Performance dashboard and GA4 feature updates quarterly.
Conclusion: Your 5-Step Action Plan for 2026
You don't need enterprise software to prove your social media work drives real business results. You already have the free social media management tools, Buffer, Canva, GA4, sitting in your tech stack. The missing piece? Knowing which AI SEO KPIs to track and how to connect the dots.
Here's your action plan:
Step 1: Audit your current setup. Open GA4, Google Search Console, and Bing Webmaster Tools. Confirm tracking is live and your social profiles link back to tagged URLs. Takes 15 minutes.
Step 2: Tag everything. Add UTM parameters to every social post link. Use utm_source=linkedin, utm_medium=social, and utm_campaign=content-pillar-name. This makes AI referral traffic visible in GA4. Your buffer social media posts, Instagram links, whatever you're using. Tag it all.
Step 3: Build your Looker Studio dashboard. Connect GSC and GA4. Add widgets for AI citation incidence (from Bing), brand search lift, and AI-assisted conversions. Bookmark it. This is what you'll actually look at instead of letting the data sit in three different tools.
Step 4: Review weekly, adjust monthly. Check which content formats and topics earn citations. Double down on what works. Kill what doesn't. Most people skip this step, which is why their social strategy never improves.
Step 5: Submit one piece of social content to AI answer engines. Use the 5-3-2 rule: five value posts, three engagement posts, two brand posts per ten. Track which format gets cited most often.
The ROI conversation with your boss just got easier.
You're no longer reporting likes. You're reporting citations, conversions, and brand visibility in the places your audience actually searches. Whether you're running the best social media management tools for small business or cobbling together the best free social media management tools you can find, this framework works. You're measuring what matters now.
This guide reflects the state of free tools and AI search as of Q1 2026. Review the Bing AI Performance dashboard and GA4 feature updates quarterly.
Frequently Asked Questions
What is replacing Facebook?
Nothing's replacing it. That's not how this works.
Attention has moved to video-first platforms (TikTok, YouTube Shorts) and community spaces like Discord or Slack. These platforms create the conversational, authentic content that AI models actually cite when answering queries [Source: almcorp.com]. For B2B SaaS, this means your Discord discussions and quick explainer videos matter more for AI visibility than Facebook page posts ever did.
How often should I review my AI SEO KPIs?
Monthly dashboard checks to catch trends in AI referral traffic, engagement rates, and citation patterns from Bing Webmaster Tools. Then a deeper quarterly review to analyze GA4 conversion paths, update your content strategy based on what's getting cited, and adjust your social mix accordingly.
AI search behavior shifts faster than traditional SEO. What works in January might need changes by March.
Can I really track AI SEO impact without paying for expensive tools?
Yes. That's the whole point of this article.
You can build a complete AI SEO measurement system using free social media management tools like Buffer and Canva, combined with Google Search Console, GA4, Bing Webmaster Tools, and Looker Studio [Source: developers.google.com]. The dashboard guide above shows exactly how to connect these tools to track citation rates, AI referral conversions, and brand visibility in AI answers. Zero dollars on enterprise software.
What is the 5-5-5 rule on social media?
The 5-5-5 rule means posting 5 pieces of industry news, 5 educational posts, and 5 promotional posts per cycle (usually weekly or monthly). It creates comprehensive topical coverage that helps AI models recognize your brand as an authority across multiple angles of your niche.
The downside? It's rigid. If you're a solo founder or small team, this cadence will burn you out fast. The 5-3-2 rule below is more sustainable while still building the topical breadth AI systems reward.
What is the 5-3-2 rule for social media?
The 5-3-2 rule breaks down as 5 curated content pieces, 3 original brand posts, and 2 personal or community-focused posts per 10-post cycle. This mix builds entity relevance (AI models see you engaging with authoritative sources), demonstrates original expertise through your brand content, and shows community connection (which signals trustworthiness).
For resource-strapped SaaS teams, 5-3-2 is more realistic than 5-5-5 while still feeding the signals that get you cited in AI answers.
What is the best social media management tool for free?
There's no universal answer. It depends on your workflow.
Look for four things: (1) the ability to export engagement data beyond vanity metrics, (2) reliable scheduling for consistent posting, (3) integration with design tools like Canva, and (4) team collaboration on the free tier if you need it. Buffer, Canva's Content Planner, and Hootsuite's free plan all meet these criteria [Source: buffer.com].
Choose based on which platform your audience actually uses. Buffer excels for multi-channel posting. Canva's scheduler works better if you're design-heavy and already living in that tool anyway.